The design techniques and physics analysis of modern stellarator
configurations for magnetic fusion research rely heavily on high
performance computing and simulation. Stellarators, which are
fundamentally 3-dimensional in nature, offer significantly more
design flexibility than more symmetric devices such as the tokamak.
By varying the outer boundary shape of the plasma, a variety of
physics features, such as transport, stability, and heating
efficiency can be optimized [1]. Scientific visualization techniques
are an important adjunct to this effort as they provide a necessary
ergonomic link between the numerical results and the intuition of the
human researcher. We have developed a variety of visualization
techniques for stellarators which both facilitate the design
optimization process and allow the physics simulations to be more
readily understood.
I. Magnetic Geometry
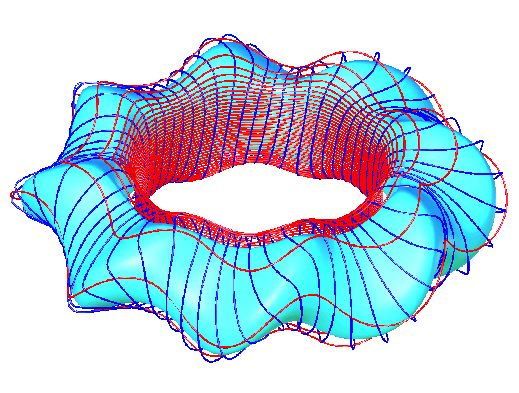
A necessary first step in the analysis of any toroidal fusion device is the selection of a coordinate system within which the equations describing the physics can be cast in a simple, but yet accurate form. This is particularly important in the case of 3-dimensional devices, such as stellarators. In Figure 1, we have displayed a typical stellarator coordinate system. The light blue isosurface is a surface of constant toroidal magnetic flux. Provided the stellarator is sufficiently symmetric, these surfaces are well-defined, nested and are typically used as the radial coordinate. Two angle coordinates are then required to complete the description. These angular coordinates traverse the short and long way around the torus as shown by the red and dark blue lines in Figure 1. A particularly convenient choice for stellarators (as shown in Figure 1) are the magnetic or Boozer coordinates [2] which allow the particle trajectory equations to be expressed in an accurate Hamiltonian form which depends only on the magnitude of the magnetic field and its derivatives. In these coordinates, the magnetic field lines are straight.
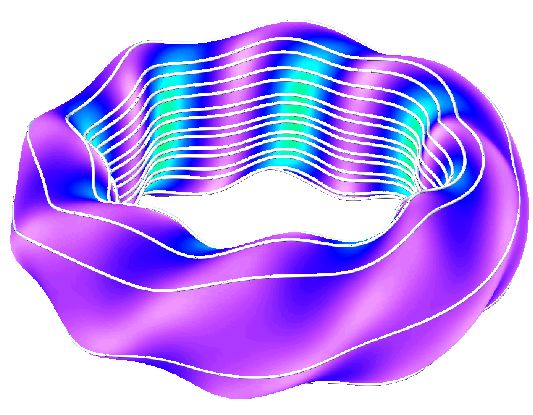
This characteristic is useful, for example, in stability analysis where derivatives along and perpendicular to magnetic field lines often are involved. In a straight field line coordinate system, such terms will not lead to mixed partial derivatives. The geometry of the magnetic field lines and the variation of the magnetic field strength within a flux surface are important quantities with respect to plasma transport and stability. In Figure 2 we display an outer magnetic flux surface of a low aspect ratio stellarator with color contours proportional to the strength of the magnetic field (light purple is low field, light blue-green is high field) and the trajectory of a magnetic field line is shown in white. As may be seen, at low aspect ratios the field line traverses the outside half of the torus more rapidly (i.e., higher local rotational transform) than the inside half. This feature has important implications for the ballooning stability of such configurations in that the field line curvature on the outside is generally destabilizing while that on the inside is stabilizing.
II. Orbit Trajectories and Transport
Optimization
Stellarators can have a wide variety of orbit trajectory types. Transport and confinement phenomena depend sensitively on the form of the trajectories and their degree of deviation away from a flux surface. Orbits can be classified into passing, transitional, or locally trapped, depending on whether they traverse all the way around the torus, part-way, or are confined within a single field period. In understanding transport, all of the orbit types are taken into account using Monte Carlo simulations which follow an ensemble of randomly distributed particles over several collision times.
In Figure 3 we give an example of a transitional orbit (shown in dark blue) which is initially trapped over several magnetic field wells, then transitions to being trapped over a few more and finally becomes locally trapped at the top of the flux surface within a single field period. The flux surface is visualized here as a semi-transparent isosurface with coloration proportional to the strength of the magnetic field. Transitional orbits are of importance in stellarator transport since they occur near the separatrices in phase space and can become stochastic over longer time periods.
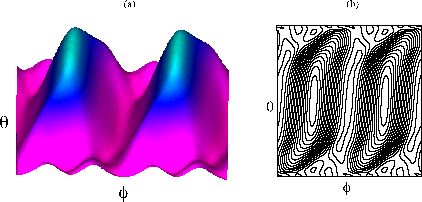
Stellarator transport optimizations focus directly on the dependence of the magnetic field strength on the two angular coordinates which span each flux surface. A variety of techniques have been developed for reducing transport either through targeting various types of symmetry or by directly reducing the deviation of the particle trajectories away from flux surfaces. In Figure 4 we show the variation of the magnetic field strength using both (a) 3-D elevations and color contouring, and (b) 2D contour lines. The two main types of symmetry-based optimization are quasi-toroidal symmetry [3] (in which the ridges/contour lines would be straight and horizontal) and quasi-helical [4] (in which the ridges/contour lines would be straight and diagonal). Omnigeneity is a recently developed method [5] which attempts to reduce the average deviation of orbit trajectories away from flux surfaces. It has been shown [6] that omnigeneity is equivalent to a constant angular separation between equal values of B within a flux surface. In terms of Figure 4 (which is close to omnigeneous), this corresponds to maintaining a constant width (Df) between adjacent terrain features at a fixed elevation ranging from the bottom of the valley to top of the peaks. Visualizations, such as these are useful for judging closeness to omnigeneity.
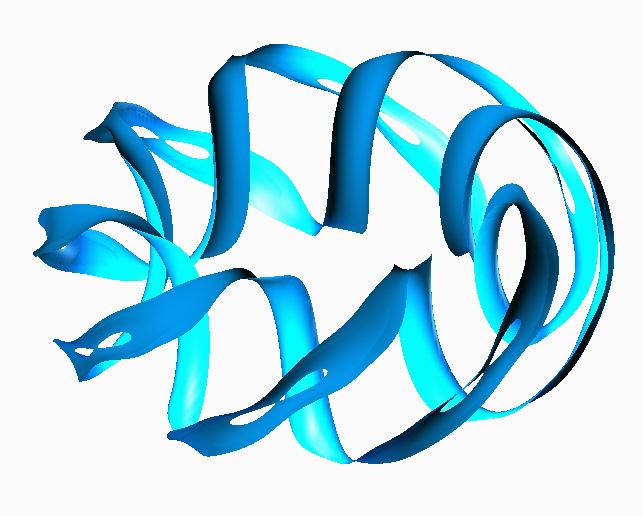
Surfaces of constant magnitude B may also be visualized in real space 3-dimensional geometry, as show in Figure 5, where we have plotted an isosurface of constant magnitude B. Omnigeneity in this context would correspond to a constant width of the ribbon. Such isosurfaces and their juxtaposition with constant density and temperature contours are also useful in evaluating the radio-frequency heating properties of a stellarator configuration since heating generally occurs near resonant cyclotron harmonic surfaces which are equivalent to constant magnitude of B surfaces.
III. Realization of Coils
A final step in the design of stellarators is the synthesis of a set of magnetic coils which will produce nested flux surfaces with the desired dependence of |B| which was developed in the physics optimization step. Visualization of these coils has been quite useful in identifying coil sets which would be difficult or impossible to realize in a practical engineering design. With the help of visualization techniques, the human eye can often times evaluate this aspect of a coil set more readily than attempting to incorporate this knowledge into a computer program. Juxtaposing within the coilset an outer flux surface with |B| color contours aids in identifying high field regions where the coils must bunch more closely together. In Figure 6 we show an example coil set and outer magnetic surface for the W7-X device [7] which is to be built in Greifswald, Germany.

IV. Conclusion
Scientific visualization has played an important role in
understanding the optimization and numerical simulation of
3-dimensional stellarator configurations. Visualization insures a
good ergonomic connection between the scientist and the plasma
simulation tools. This allows early detection of errors, more rapid
development of intuition and an excellent medium for communicating
results both to one's peers as well as to non-technical
audiences.
Acknowledgment
We would like to acknowledge Peter Merkel of the
Max-Planck-Institut für Plasmaphysik IPP-Greifswald for
providing the data used in Figure 6 and much help from Steve Hirshman
in using the VMEC optimization/equilibrium code. This research is
sponsored by the Office of Fusion Energy U. S. Department of Energy,
under contract DE-AC05-960R22464.
References:
[1] D. A. SpongÝ, S. P. Hirshman, J. C. Whitson, D.B. Batchelor, B.A. Carreras, V.E. Lynch, and J.A. Rome, "J* Optimization of Small Aspect Ratio Stellarator/Tokamak Hybrid Devices," to be published in Physics of Plasmas, 1998.
[2] A. H. Boozer, Phys. Fluids 26 496 (1983).
[3] P. R. Garabedian, Phys. Plasmas 3 2483 (1996).
[4] J. Nührenberg, R. Zille, Phys. Lett. A129 113 (1988).
[5] S. P. Hirshman, D. A. Spong, J. C. Whitson, D. B. Batchelor, B. A. Carreras, V. E. Lynch, J. A. Rome, "Transport Optimization and MHD Stability of a Small Aspect Ratio Toroidal Hybrid Stellarator," accepted for publication in Phys. Rev. Lett., 1997.
[6] J. R. Cary, S. G. Shasharina, Phys. Rev. Lett. 78, 674 (1997).
[7] J. Nührenberg, W. Lotz, P. Merkel, C. Nührenberg, U. Schwenn, E. Strumberger, T. Hayashi, Fusion Technology, 27 (1995) 27.