
OFFPRINT
Vol. 62 … Number 3 … pp. 452-458
Trapping intermediates in the melting transition
of DNA oligomers
![]()
A. MONTRICHOK, G.
GRUNERand G. ZOCCHI

Published under the scientific
responsibility of the
![]()
OFFPRINT
Vol. 62 … Number 3 … pp. 452-458
Trapping intermediates in the melting transition
of DNA oligomers
![]()
A. MONTRICHOK, G.
GRUNERand G. ZOCCHI
Published under the scientific
responsibility of the
![]()
Incorporating
JOURNAL DE PHYSIQUE LEITRES … LEITERE AL NUOVO CIMENTO

![]() EUROPHYSICS LETTERS 1 May 2003
EUROPHYSICS LETTERS 1 May 2003
Europhys. Lett., 62 (3),
pp. 452-458 (2003)
Trapping intermediates in the melting transition
of DNA oligomers
A. MONTRICHOK, and G. ZOCCHI G. GRÐNER
Department
of Physzcs and Astronomy, University of California Los Angeles
Los
Angeles, CA 90095-1547, USA
(received 15
November 2002; accepted in final form 19 February 2003)
PACS. 87.15.
-v -Biomolecules: structure and physical properties.
Abstract. -We present a
new method to study the melting transition of DNA oligonu-
cleotides, which can quantify the presence of intermediate states. The approach
is to combine
UV spectroscopy with a method based on trapping intermediate states by
quenching. The measurements yield both the average fraction of open base pairs
(f) and the fraction of com-
pletely open molecules (p). If intermediate (partially open) states are not
present, then p = f
throughout the transition. In the presence of intermediate states, p < f. We
demonstrate the
method on the example of a 48mer sequence which is designed to open at one end
and thus
have intermediate states during melting. Then we show a different sequence
design where the
melting appears essentially as a two-states process. These experiments
demonstrate the role
played by end effects and sequence design in controlling the nature of the
melting transition
for DNA oligomers.
Introduction. - At
sufficiently high temperatures, the DNA double helix melts and the
molecule separates into two single strands. While this transition has been
studied extensively,
the question of what conformations are statistically significant during melting
is not clear.
Long DNA molecules give rise to steps in the melting curves [14], corresponding
to different
regions of the molecule melting at different temperatures. For synthetic
oligonucleotides with uniform sequences this behavior is not observed [12].
In molecular
biology, thermal denaturatiorl is exploited with the polymerase chain reaction
(PCR). For quantitative PCR [7-l0], an understanding of the sequence
specificity of the hybridization and melting processes is desirable.
For short oligomers (< 10
bp) an adequate representation of the melting transition is
obtained from a two-states model in which the molecules are either completely
closed or com-pletely open. For long molecules, a better description is
obtained from the "zipper model" [11], which allows partially open
(intermediate) states. Two main approaches have been studied:
Ising-type models, which assign an energy difference for paired and unpaired
bases [12-17], and models which introduce a potential energy function of the
distance between the bases [18-22]. Depending on the details of the treatment
of the entropy of single-stranded loops, these models predict a continuous
[14-16,19] or discontinuous [17,18,21,22] transition in the thermodynamic
limit.
![]()
A. MONTRICHOK et
al.: TRAPPING
INTERMEDIATES IN THE MELTING TRANSITION ETC. 453
Experimentally,
several techniques are employed to characterize the transition [11], in-
cluding UV absorption, circular dichroism (CD), fluorescence spectroscopy, and
calorimetry.
The thermodynamic parameters have been measured by spectroscopic [23]or
calorimetric [24] methods, or a combination [25,26]. Fluorescence energy
transfer has been used to measure
free-energy differences through competitive binding assays 1271, and to probe
the dynamics of hairpin formation [28]. Temperature gradient gel
electrophoresis (TGGE) can detect confor-mational transitions and mismatches
[29-32].
Melting is usually monitored by the UV absorption new 260 nm; this absorption increases
typically by 40% going from double
strand to single strand, due to the fact that the cor-
responding electronic transitions within the bases
are partially screened when the bases are
stacked. In the context of melting studies, these spectroscopic measurements
are interpreted
as yielding the average fraction
of open base pairs, which we call f.
A limitation common
to all spectroscopic methods, which average over the whole molecule
population, is that one cannot
distinguish between different configurations. For example,
at a temperature where the UV absorption indicates
that half the base pairs are open, the measurement does not distinguish a
situation in which half the molecules are completely open
and half are completely closed, from a situation in which all molecules are
half-way open. One does not have direct access to intermediate states.
Here we introduce a
new method to trap intermediate (i.e. partially open) states. The
principle is to use partially
self-complementary sequences, so that the single strands can form hairpins (hp). A sample initially in the duplex state (i.e. hybridized to its reverse comple-
ment) is taken to a given temperature T
within the transition range, then quenched to lower temperature. Strands which
were completely separated at the temperature T are trapped
in the hairpin conformation after quenching, and the fraction of hairpins can
be determined
by gel electrophoresis. This
method was used in the laboratory of Deborah Fygenson [33]
to study how DNA-binding dyes affect the melting temperature. Our approach here
is to
combine spectroscopic measurements
with this quenching technique in order to measure both
the fraction of open base pairs
and the fraction of completely open molecules. This allows us
to quantify the presence of intermediate states.
First, we demonstrate
the method on a 48mer sequence (L48AS) designed to open at one
end; we find that for this
sequence, at the midpoint of the transition all molecules are in intermediate, partially open states. Then we present the
case of a 42mer sequence of different design, where the transition turns out to
be essentially a two-states process. Thus we show that for the finite-size
system, the nature of the transition is controlled by end effects and therefore
sequence design.
Experimental
technique. - Sample preparation. Synthetic DNA oligonucleotides were
purchased from Operon Technologies, HPLC purified. The two sequences used in
this study
(fig. 1) are partially self-complementary, thus the ss can form hairpins as
indicated in the
figure. However, the ground state is the duplex (ss + reverse complement, not
shown in the
figure). In the duplex form, L48AS has a G-C-rich (i.e. more
stable) region at one end, and
an A-T-rich region at the other. L42Vl has G-C-rich regions at both ends and an
A-T-rich
region in the middle.
For the experiments,
the initial state was prepared in the duplex (ds) form by
annealing
each oligomer with its reverse complement, at an oligomer concentration of 50![]() M, in PBS di-
M, in PBS di-
luted by 3 (3 mM phosphate buffer, 1mM Kcl, 46 mM NaCl). Samples were brought
to 90 ƒC and cooled overnight, then
diluted in the same buffer to reach the desired oligomer concentra-
tion for the experiments, which was 1![]() M both for the quenching and the UV measurements.
M both for the quenching and the UV measurements.
UV
absorption measurements were performed at 260 nm with a Beckman Coulter
DU-640
![]()
454 EUROPHYSICS
LETTERS
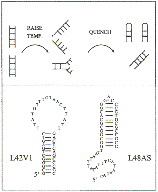
Fig. 1 -
Synopsis of the quenching method wed to trap intermediate states. Completely
open
molecules can be sorted from partially open ones because the former form hairpins
upon quench-
ing to lower temperature. The lower part of the figure shows the two sequences
used in this study, and the hairpins they
can form.
spectrophotometer equipped with temperature-controlled
sample holder. The temperature
ramping rate was 0.5 ƒ/min. CD measurements were performed on a Jasco
spectrometer at
248 nm.
Quenching technique. To measure the fraction of completely open molecules
we developed
the following technique. A number of aliquots (i) of the same sample are heated to different
temperatures Ti within
the transition range and then quenched to ~ 0ƒC
Molecules which
were completely open at the temperature Ti (i.e.
single strands, ss) form hairpins after quench-
ing, while molecules which were partially open close again as duplexes (fig.
1). This occurs because under the dilute conditions of the experiment it is
faster for single strands to form
hairpins upon quenching. Subsequently, the aliquots are run on a gel, and the
relative amount
of hairpins and duplex molecules is determined from the intensities of the two
bands. The
relative amount of hairpins represents the equilibrium fraction of completely
open molecules
at temperature Ti. Note that this is an equilibrium, not a
kinetic measurement.
Trapping the single
strands in the hairpin conformation lowers the rate of ss Æds recom-
bination, which makes the experiment practical. The key observation is that a
sample which
is not heated produces a ds band (and no hp band) in the gel (fig. 2a, bottom
lane), while a
sample which was heated at sufficiently high temperature and quenched shows up
entirely as a
hp band in the gel (fig. 2a, top lane). This shows that the interconversion hp ![]() ds after
ds after
quenching is slow enough that the experiment is viable, and that the
electrophoresis process
does not transform hairpins into duplexes or vice versa. Thus the method may be
better
suited for melting studies than TGGE.
In practice,
30 ml aliquots
(DNA concentration 1 mM) in PCR
tubes were brought to the
desired temperature in a water bath for 3 min, then quenched to 0 ƒC by plunging the tubes
in ice water. Gel electrophoresis
(typically 80min at 100V) was run in a chilled mini-sub
A. MONTRICHOK et al.: TRAPPING INTERMEDIATES IN THE MELTING TRANSITION
ETC.
455
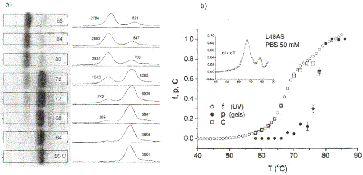
Fig. 2 - Melting transition for the 48mer L48AS
in PBS 50mM. a) Gel electrophoresis of aliquots
which were heated to the temperatures indicated on the lanes and quenched to 0
ƒC. The gel runs
right to left. There are only two species present: duplexes (slow band) and
hairpins (fast band). Next
to the lanes we plot the intensity profiles; the numbers are proportional to
the areas under the peaks.
b) The fraction of open base pairs f (open circles; obtained from the UV
absorption measurements),
the fraction of open molecules p (filled circles; obtained from the
gels), and the quantity C (squares;
calculated from eq. (3)),which represents the mean bubble length. The inset
shows the derivative of the UV data: two peaks are visible, corresponding to
the two steps in the UV curve.
cell (BioRad) under TE
buffer with ethidium bromide, using 3% agarose gels (LMP from
Promega). Gels were photographed
under UV illumination with a digital camera (Fuji FinePix
4900), and the intensities of the
bands read out using the image analysis program Scion Image.
The same bands are obtained if the gels are stained at the end.
Data analysis. From the UV absorption measurements
we obtain the average fraction
of open base pairs, f. From the quenching technique, we obtain the average fraction
of
open molecules, p. The
relationship between these quantities yields a characterization of the
transition. If bubbles are present at a given temperature, then at that
temperature p <
f. In
the case that the molecules unzip gradually, in the transition region (0 < f < 1) there will
be mostly partially open molecules, i.e. p ª 0. In the opposite extreme
case of a two-states transition, p = f throughout.
I) Normalization
of the spectroscopic measurements. Calling Amin and Amax
the minimum
and maximum values of the absorption (or
CD signal) within the transition region, we calculate
the fraction of open base pairs f as
![]()
where A(T) is the
absorption (CD signal) at temperature T. All UV and CD curves
show
clear plateaus at temperatures well below the transition; the corresponding
values determine
Amin. Amax is easily determined in the case of L42V1,
because the CD curve has a plateau for
76 ƒC < T < 85 ƒC (fig. 3). In the case of L48AS (fig. 2b), one can discern
in the UV curve
two steps, which given the sequence of L48AS, must be tentatively assigned to
the melting of
![]()
![]() EUROPHYSICS
LETTERS
EUROPHYSICS
LETTERS
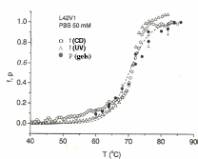
Fig. 3 -
Melting transition for the 42mer L42V1 in PBS 50 mM. The fraction of open bp obtained
both
from the CD (open circles) and UV measurements (triangles) is shown, together
with the fraction
of open molecules p (filled circles). The dashed line is a fit of the CD curve with
the two-states
model [11]: f = exp![]() , where e and s are energy
and entropy parameters
, where e and s are energy
and entropy parameters
(the melting temperature is then Tm=![]() , at which point f = 1/2). The parameters of the fit
were
, at which point f = 1/2). The parameters of the fit
were
Tm= 343.0K, ![]() = 3.83 x l04 K.
= 3.83 x l04 K.
first the
A-T-rich region and then the G-C-rich region. We normalized the UV curve so
that
f = 1 after the second step. This also produces a melting curve
which is consistent with the
gel data, since the two curves then cross at f = 1, p = 1 (T ª 81 ƒC).
II) Normalization of the gel
measurements. There are several ways of calculating the
hairpin fraction from the band intensities in the gels. Calling hp(T) the
intensity of the
hairpin band of the aliquot which was brought to temperature T, and ds(T) the
intensity of
the duplex band, we used the following normalization for the hairpin fraction p:
![]()
This quantity
compares hp and ds intensities within the same lane,
and is independent of the amount of sample in the lanes. Alternatively, we can
compare bands across lanes, and obtain
a normalization which is independent of the efficiency of dye binding to the
two structures,
hairpin and duplex. The two normalizations give rise to the same melting
curves.
Results. - Figure 2a
shows the gel for L48AS. The temperatures to which the samples
were heated before quenching are indicated on the lanes. The initial state is
prepared in the
duplex form. At the highest temperature (86 OC) the sample has turned almost
entirely into hairpins. The plots on the right show the intensity integrated
across the lane; the areas under
the peaks were used to obtain the melting curves shown in the next figures.
The melting curves
are shown in fig. 2b. Here and in the next figure, errors were estimated
from the reproducibility of the data and analysis; they are of order 3% for the UV
data and
10% for the gel data. The data clearly reveal the presence of intermediate
states, since p < f throughout the transition. At a temperature
such that f = 0.5 (T ª 68 ƒC),
essentially no
molecules are completely open (p ª 0), i.e. all molecules are in
intermediate (partially open)
states. We can quantify the average conformation of these intermediate states
by introducing a quantity C which is the average fraction of
open base pairs within the partially open molecules
4. MONTMCHOK
et al.: TRAPPING INTERMEDIATES IN
THE MELTING TRANSITION ETC. 457
(this is the
average size of the bubble for the partially open molecules). The total
fraction of
open base pairs can be written as
![]()
where the
first term is the fraction of partially open molecules multiplied by the
fraction of
open bp within this subset, and the second term is the fraction of
completely open molecules. Therefore
C = (f ñ P)/(1 ñ P). (3)
Note that close to
the endpoint of the transition, f ª p ª 1 and from (3) the error bars
for C will be large. The quantity C, calculated
from f and p using eq. (3), is plotted in fig. 2b
as open squares. We see that the average size C of the single-stranded region
accounts for
the whole fraction of open base pairs (C = f) till the
first kink in the UV curve (T ª 70 ƒC).
Beyond that temperature C seems to reach a plateau. This suggests the
following picture of
the transition: the A -T-rich region at one end unzipps gradually with
increasing temperature, until a temperature is reached where the G-C-rich
region starts to melt (T ª 70 ƒC), this
latter
process happening abruptly. In summary, the behavior of the quantity C suggests a
continuous transition for the A -T-rich region, and a discontinuous one for the
G-C-rich region.
In fig. 3 we show the melting curves for
L42V1. Apart from being slightly shorter, this
sequence is different from L48AS: in the duplex form it has G-C-rich regions at
the two ends,
and an A-T-rich region in the middle. The melting behavior is completely
different from that observed for L48AS: essentially, no intermediate partially
open states are detected (p = f throughout), i.e. within the
resolution of the method, the transition appears as a two-states
process. This is not apparent from the f curve or the p curve alone, which are
continuous
(the transition region has a finite width) because of finite-size effects.
Discussion. - We have
introduced a new method to study intermediate states in the
melting transition of DNA oligonucleotides. By combining a spectroscopic
technique (UV absorption) with a simple method based on quenched states we
measure both the average
fraction of open base pairs f and the fraction of completely open
molecules p. From the
relation between these two quantities we quantify the presence of intermediate
states. We
find that a sequence designed to open at one end indeed shows such equilibrium
intermediate
states. However, a second sequence which could be expected to develop a
denaturation bubble
in the middle instead melts in a two-states process. This demonstrates that end
effects, and therefore sequence design, can control the nature of the
transition in the case of oligomers.
The method presented here offers a
clear-cut criterion for recognizing a first-order transi-
tion behavior (f = p). In the case of oligomers, this is not obvious from the UV
absorption
curves alone, which always look continuous because of finite-size effects.
Furthermore, the
abrupt melting of stable regions can be detected by plateaus in C. We believe
the method
can systematically address the role of end effects, oligomer length, and
sequence in shaping
the character of the melting transition.
![]()
We acknowledge helpful discussions with D.
FYGENSON. This research was partly sup-
ported by NSF grant DMR 0077251 (GG) and by the US-Israel Binational Science
Foundation under grant no. 2000298 (GZ).
![]()
458 EUROPHYSICS LETTERS
REFERENCES
[1] BEERS W.,
CERAMI A. and REICH E., Pm. Natl. Acad. Sci. USA, 58 (1967) 1624.
[2] WARTELLR.
M. and BENIGHTA. S., Phys. Rep., 126 (1985) 67.
[3] MAEDA Y.
and OHTSUBO E., J. Mol. Biol., 194 (1987) 691.
[4] ABRAMS E.
S., MURDAUGH S. E. and LERMAN L. S., Nucleic Acids Res., 23 (1995) 2775.
[5] MARX K. A. et al., J. Biomol. Struct. Dynam., 16 (1998) 329.
[6] BLAKE R. D.
and DELCOURT S. G., Nucleic Acids Res., 26 (1998) 3323.
[7] GILLILAND
G. et al., Proc. Natl. Acad. Sci. USA, 87 (1990) 2725.
[8] HOLLAND P.
M. et al., Proc. Natl. Ad. Sci. USA, 88 (1991) 7276.
[9] GIBSON U. E., HEIDC. A. and WILLIAMS P. M., Genome Res., 6 (1996) 995.
[10] WITTWERC. T. et
al., BioTechnigues,22
(1997)
130; 134.
[11] CANTOR C. R. and SCHIMMEL P.
R., Biophysical Chemistry (Freeman, New York) 1980.
[12]
HILL T. L., J. Chem. Phys., 30 (1959) 383.
[13]
ZIMM B. H., J. Chem. Phys., 33 (1960) 1349.
[14]
POLAND D. and SCHERAGA H. A., J. Chem. Phys., 45 (1966) 1456; 1464.
[15]
FISHER M. E., J. Chem. Phys., 45 (1966) 1469.
[16]
AZBEL M. YA., Phys. Rev. A, 20 (1979) 1671.
[17]
CAUSO M. S., COLUZZI B. and GRASSBERGER P., Phys. Rev. E, 62 (2000) 3958.
[18]
KAFRI Y., MUKAMEL D. and PELITI L., Phys. Rev. Lett., 85 (2000) 4988.
[19]
PEYRARD M. and BISHOP A. R., Phys. Rev. Lett., 62 (1989) 2755.
[20]
DAUXOIS T. and PEYRARD M., Phys. Rev. E, 51 (1995) 4027.
[21]
THEODORAKOPOULOS N., DAUXOIS T. and PEYRARD M., Phys. Rev. Lett., 85 (2000) 6.
[22]
CULE D. and HWA T., Phys. Rev. Lett., 79 (2000) 2375.
[23] VAMOSI G. and CLEGG R. M., Biochemistry, 37 (1998) 14300.
[24]
CHALIKIAN T. V. et al., Proc. Natl. Acad. Sci. USA, 96 (1999) 7853.
[25]
VESNAVER G. and
BRESLAUER K. J.,
Pm. Natl. Ad. Sci. USA, 88 (1991) 3569.
[26]
VOLKER J. et al., Biopolymers, 50 (1999) 303.
[27]
GELFAND C. A. et al., Pm. Natl. Acad. Sci. USA, 96 (1999) 6113.
[28]
BONNET G. et al., Pmc. Natl. Acad. Sci. USA, 96 (1999) 6171.
[29] RIESNERD. et al., Electrophoresis, 10 (1989)
377.
[30] ZHU J. and WARTELLR. M., Biochemistry, 36 (1997) 15326.
[31] BRION P., MICHEL F., SCHROEDER R. and WESTHOF E., Nucleic Acids
Res., 27 (1999) 2494.
[32] VIGLASKY V. et al., Nucleic Acids Res., 28 (2000)
E51.
[33] BJORNDAL M. T. and KUCHNIR FYGENSON D., Biopolymers,
65 (2002)
40.
![]()