The
electrical conductivity of DNA has been a topic
of much recent interest and controversy [1]. Measure-
ments from different groups have reached a variety of conclusions about the
nature of charge transport along
the double helix. DNA has been reported to be metallic [2],semiconducting
[3],insulating [4,5], and even a prox-imity effect induced superconductor [6].
However, ques-tions have been raised with regards to the role played
by electrical contacts, length effects, and the manner in which electrostatic
damage, residual salt concentrations, and other contaminations may have affected
these results [1]. More recent measurements, where care was taken to both
establish a direct chemical bond between l-DNA and Au
electrodes and also control the excess ion con-centration, have given
compelling evidence that the DC resistivity of the DNA double helix over long
length scales (< l0mm) is very
high indeed ( ) [7]. Such DC measurements contrast with recent contactless AC measurements
that have shown that there is appreciable conductivity at microwave and
far-infrared frequencies [8,9] the magnitude of which approaches that of a
well-doped semiconductor [l0].
) [7]. Such DC measurements contrast with recent contactless AC measurements
that have shown that there is appreciable conductivity at microwave and
far-infrared frequencies [8,9] the magnitude of which approaches that of a
well-doped semiconductor [l0].
Previously,
the AC conductivity in DNA was found to
be well parameterized as a power-law in w [8,9]. Such a
dependence can be a general hallmark of AC conductiv-
ity in disordered systems with photon assisted hopping between random localized
states [ll]and led to the rea-sonable interpretation that intrinsic disorder,
counterion fluctuations, and possibly other sources created a small number of
electronic states on the base pair sequences
in which charge conduction could occur. However, such
a scenario would lead to thermally activated hopping conduction between
localized states and is thus incon-sistent with the very low DC conductivity
[7]. A number
of outstanding issues arise: Are there localized regions along the helix where
a continuous conducting path is
not present, but still AC hopping between localized states over distances of a
few base pairs can occur? Are there sensitive length dependencies in the DNA
strands? Is
there a difference between between
the samples of vari-
ous groups? Perhaps different charge conduction mechanisms play a role at
finite frequency.
To the end of
resolving some of these matters, we have performed AC conductivity experiments
in the millime-
ter wave range under a wide range of humidity condi-
tions. We show that the appreciable AC conductivity of DNA in the microwave and
far infrared regime should
not be viewed as some sort of hopping between localized states and is instead
likely due to dissipation in the dipole response of the water molecules in the
surrounding hy-dration layer. It can be well described by a Debye-like
relaxation of water molecules in the surrounding water helix. At low humidities
the response is well modelled by considering the rotation of single water
molecules in the structural water layer. As the number of water molecules per
base pair increases, dissipation due to the collective motion of water dipoles
increases, until eventually the conductivity resembles that of bulk water. By
measur-
ing both single strand (ssDNA) and double strand DNA (&DNA) over a wide
range of humidities we are able to show that, at least in principle, all the AC
conductiv-
ity of DNA can be assigned to relaxation losses of water dipoles. This result
reconciles the apparent complete lack of DC conductivity with the appreciable
AC response.
Double
stranded DNA films were obtained by vac-
uum drying of 7mM PBS solution containing 20 mg/ml sodium salt DNA extracted
from calf thymus and salmon testes (Sigma Dl501 and D1626). The results were
found to be independent of the use of calf or salmon DNA. Our choice for these
concentrations deserves further explana-tion. It is well known that at a given
temperature double helical conformation of DNA can exist in solution only with
a certain concentration of positive ions. Excess salt cannot be removed by
vacuum drying, so large amounts of residual salt in films could introduce
significant er-
rors in conductivity, due to both the ionic conduction of the salt itself and
its additional hydration during humid-
ity changes. Melting temperature calculations [12,13] for
long native pieces of DNA with C-G content
around 40% show that 2-10 mM
concentration of sodium cations is enough to stabilize the double helix at room
temperature. Films were prepared with differing salt amounts and it
was found that as long as the excess salt mass fraction is kept between 2-5%
the final results were not significantly affected. In order to improve the
DNA/salt mass ratio
we used a high concentration of DNA, but 20 mg/ml appears to be the limit.
Higher concentrations makes
it difficult for DNA fibers to dissolve and the solution becomes too viscous,
which prevents producing the flat uniform films which are of paramount
importance for the quasi-optical resonant technique. Single stranded DNA films
were prepared from the same original solution as the double stranded ones, with
preliminary heating up to 95
C for 30 minutes and fast cooling down to 4 C. In both dsDNA and ssDNA cases
the conformational state was checked by fluorescent microscope measurements.
The
dry films were 20 to 30 microns thick and were made
on top of 1mm thick sapphire windows. Immediately af-
ter solution deposition onto the sapphire substrates the
air inside the viscous solution was expelled by vacuum centrifuging at 500g,
otherwise the evaporation process causes the formation of air bubbles that
destroy the film uniformity.
The AC
conductivity was measured in the millimeter spectral range. Backward wave
oscillators (BWO) in a quasi-optical setup (100 Ghz -1 THz) were employed as
coherent sources in a transmission configuration. This difficult to access
frequency range is particularly relevant as it corresponds to the approximate
expected time frame for relaxation processes in room temperature liquids (1-
10 ps). Importantly, it is also below the energy range
where one expects to have appreciable structural excita-tions. The technique
and analysis are well established
[14]. We utilize the fact that for plane waves incident normally on a slab of
material, transmission resonances occur when the slab is an integer number of
half wave-lengths. Thus, using a » 1 mm
sapphire disc as a sub-
strate, resonances occurred approximately every 50 GHz. Having analyzed the
transmission through the sapphire alone prior to mounting the sample, the
optical proper-
ties of the substrate were well characterized. Thus using
a two-layer transmission model, each resonance can be analyzed to extract the
optical properties of the DNA
film, allowing for a 1.5 cm-l resolution of the
spectra.
Samples were
measured at room temperature at several fixed humidity levels which were
maintained by putting them in a hermetically sealed environment with a satu-
rated salt solution [15]. The change in thickness and mass of the DNA films at
different humidities were tracked by separate measurements within a controlled
environ-
ment for each sample in a glove box. The total number of water molecules per
nucleotide A can be correlated to the relative humidity x
(x=0-1) through the so-called
Branauer-Emmett-Teller (BET) equation [16]
 .
.
The constant B is the
maximum number of water molecules in the first layer sites. According to the
statis-tical formulation of the BET equation by Hill [17], mobile water
molecules within the double helix can be charac-terized as 2 types. The first
are ones within the initial hydration layer, which are directly attached to DNA
and have a characteristic binding energy  Water molecules
of the second and all other layers can be approximated
as having a binding energy . To a
good approximation this
. To a
good approximation this  can be taken to be that of bulk water. These parameters
enter into the BET equation through the ex-
can be taken to be that of bulk water. These parameters
enter into the BET equation through the ex-
pression for C which equals  where D is re-
lated to the partition function of water. Also we should
note that there is, in actuality, a structural 0-th layer
of water molecules, containing 2.5-3 water molecules per nucleotide that cannot
be removed from the helix under typical conditions [18].
FIG. 1.
Absorbtion of water molecules per nucleotide as a function of humidity. The
data represented by the open
circles is taken from Falk et. al.
That it is reasonable that the mobile water layers of
DNA can be modelled by distinguishing 2 different sets
of water parameters was first established by Falk et al.'s
[15] use of the BET equation to describe the hydration
of sodium and lithium DNA salts from calf thymus and salmon testes. They found
good agreement between ex-perimental data and theory with constants B = 2.2 and
C = 20. We performed a similar
hydration study of our dsDNA and ssDNA films; as shown in Fig. 1 the hy-
dration of our films are perfectly consistent with Falk's result. Note that
there is no appreciable difference in the hydration between dsDNA and ssDNA.
In Fig. 2 we present
data for the extracted  of
of
both dsDNA
and ssDNA thin films. One can see that
in both cases, the conductivity is an increasing function
of frequency. Since the conductivity is also an increasing function of
humidity, one may wish to try to seperate the relative contributions of charge
motion along the DNA backbone from that of the surrounding water molecules.
FIG. 2. Frequency
dependence of the conductivity of calf thymus DNA at different relative
humidity levels. (a) Double stranded DNA (b) Single stranded DNA (c) A
comparison of conductivity between single and double stranded DNA.
First, one can
consider that there should be two main effects of hydration in our dsDNA films.
There is the hydration itself, where water molecules are added in lay-
ers to the double helix; this is well described by BET equation 1161.
Additionally, the conformational state of &DNA also changes as a function
of humidity. For exam-ple, sodium salt calf thymus DNA is in a B-like
disordered form at humidities from 0-40%, above which it transfers to the A
form, and finally to a well ordered B-form at humidities higher than 80%
[19,20]. Additional water molecules certainly contribute to the increase in
conduc-tivity, but at high humidities there is the possibility that some of the
conduction might be due to an increase in electron transfer along the dsDNA
helix in the ordered
B form. However since such an effect would be
much re-duced in disordered and denaturalized ssDNA films and since Fig. 2
shows that to within the experimental un-certainty the conductivity of dsDNA
and ssDNA in the millimeter wave range is identical, it is most natural to
suggest that water is the major contribution to the AC conductivity. From this
comparison of dsDNA and ss-DNA, we find no evidence for charge conduction along
the DNA backbone.
In Fig. 3 we
plot the the conductivity  of the DNA
films normalized by the expected volume fraction of wa-
of the DNA
films normalized by the expected volume fraction of wa-
ter molecules including both the hydration layers plus the structural water.
Although this normalization reduces
the spread in the thin film conductivity at the lowest fre-quencies it does not
reduce it to zero, showing that if the largest contribution to the conductivity
comes from wa-
ter, the character of its contribution changes as a function
of humidity.
The complex dielectric
constant of bulk water has been shown to be well described by a biexponential
Debye re-laxation model [21-23], where the first relaxation pro-
cess [21], characterized by a time scale tD = 8.5 ps, corresponds to
the collective motion of tetrahedral war ter clusters, and the second from
faster single molecu-lar rotations [24] with a time scale tF = 170 fs. For
bulk water, the contribution of each relaxation process is determined by the
static dielectric constant eS (T) =
87.91e-0-0046T[°C],, e1 = 5.2, and
the dielectric constant
high frequencies e∞ = 3.3.
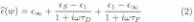
When applying
Eq. 2 to the dipole relaxation losses of DNA, one expects that the relative
contributions of the
two frequency dependent terms will change as increas-
ing humidity increases the average effective coordinate number. For instance,
at 0% humidity it is reasonable to assume that the first term which is due to
the collec-
tive motion of water clusters, cannot play a role as the structural water is
not tetrahedrally coordinated. For
high hydration levels, where multiple water layers exist around the dipole
helix, the relaxation losses of the water layer may approach those of bulk
water. We can com-
pare the above equation using the independently known values [21] for tD, , eS , tF and e1 to the experimental data normalized
to the expected volume fraction of the water from the independently determined
water uptake curves shown in Fig. 1. In Fig. 3, along with the experimental
data at two representative humidity levels, two theoreti-
cal curves for 0% and 100% humidity are plotted. With
the only two assumptions being that at 0% humidity, the sole relaxational
losses come from singly coordinated wa-ter molecules in the structural water
layer and that it is
only at higher humidity levels where the collective losses can gradually play a
greater role, the theoretical curves provide a very good fit
to the data over almost all of
the measured
frequency range. At low humidity the data
is well matched by the theory incorporating only single molecule rotations. At
high humidity, the data begins
to approach the behavior of 'free' water. For these two limits the theoretical
curves have no free parameters.
FIG. 3.
Conductivity of dsDNA and ssDNA films normal-ized by the volume fraction of all
water molecules (structural plus hydration layer). For clarity, only 0% and 84%
humidi-ties are shown. The solid line represents the conductivity of pure water
as modelled by the biexponential Debye model us-ing the parameters of Ronne et
al. The dashed line shows just the contribution from single water molecule
relaxation.
The only
appreciable discrepancy between theory and experiment is the high frequency
data at low humidity, where the biexponential Debye model underestimates the
conductivity. This may be due to a number of reasons. At very low relative
humidities it is possible for the ionic phosphate groups on the DNA backbone to
form sta-
ble dihydrates which may give their own contribution to relaxation losses
through their additional degree of free-dom [15]. Alternatively, it may also be
that at higher frequencies for low hydration samples, the weak restor-
ing force from charge-dipole interaction in the structural water layer begins
to become more significant and our biexponential Debye model becomes less
applicable.
In
conclusion, we have found that the considerable AC conductivity of DNA can be
largely ascribed to relax-ational losses of the surrounding water dipoles. The
con-ductivity of ssDNA and dsDNA was found to be identical to within the
experimental error, indicating that there is essentially no charge conduction
along the DNA back-
bone itself. The conclusion that the observed conductiv-
ity derives from the water layer is supported by the fact that, over much of
the range, it can be well described by a biexponential Debye model, where the
only free param-
eter is the relative contributions of single water molecule and tetrahedral
water cluster relaxation modes. Gener-
ally speaking, because many large biomolecules have sur-
rounding water layers, a result such
as ours shows that
one must be aware of the possibility of such relaxation losses when
investigating the electrodynamic response of such systems.
 We would like to
thank K. Greskoviak for help with sample preparation. The research at UCLA was
sup-
We would like to
thank K. Greskoviak for help with sample preparation. The research at UCLA was
sup-
ported by the National Science Foundation grant DMR-0077251.
[1] C. Dekker and M. Ratner, Physics
World 14, 29 (2001).
[2] H. W.
Fink and C. Schonenberger, Nature 398, 407
(1999).
[3] D. Porath et a!., Nature 403, 635 (2000).
[4] E. Braun et al., Nature 391, 775 (1998).
[5] P. J. de Pablo et
al., Phys. Rev. Lett. 85, 4992 (2000).
[6] A. Y. Kasumov et
al., Science 291, 280 (2001).
[7] Zhang et at. Phys. Rev.
Lett. 89, 198102 (2002).
[8] P. Tran, B.
Alavi and G. Grüner, Phys. Rev. Lett. 85,
1564 (2000).
[9] E. Helgren et at. cond-mat/0111299.
[10] E. Helgren, N.P. Armitage,
and G. Grüner, Phys. Rev.
Lett. 89, 246601 (2002).
[11] A. L. Efros and
B. I. Shklovskii, J. Physics C 8, L49
(1975).
[12] E. Breslauer et al., Proc. Nat.
Acad. Sci. 83, 3746 (1986).
[13] N. Sugimoto et al., Nucl. Acids
Res. 24, 4501 (1996).
[14] A. Schwartz et al., Rev. Sci. Instrum. 66, 2943 (1995).
[15] M. Falk, K. Hartman, R. Lord, J.
Am. Chem. Soc. 84, 3843 (1962).
[16] S. Braunauer, P. Emmett, E. Teller,
J. Am. Chem. Soc.
80, 309 (1938).
[17] T. L. Hill, J.
Chem. Phys. 14, 263 (1946).
[18] N. Tao and S.
Lindsay, Biopolymers 28, 1019 (1989).
[19] V.Y. Maleev et
al., Biofizika 38, 768, (1993).
[20] S. M. Lindsay et
cd. Biopolymers, 27, 1015, (1988).
[21] C. Ronne et al., J. Chem.
Phys. 107, 5319 (1997)
[22] J. Kindt, C. Schmuttenmaer, J.
Phys. Chem. 100, 10373 (1996).
[23] J. Barthel, R. Buchner, Pure and
Appl. Chem. 63, 1473 (1991).
[24] N. Agmon, J. Phys. Chem. 100, 1072
(1996).