M.2.4 Sonic Basketball
Data Studio is used with Pasco probes to demonstrate the kinematics of one-dimensional motion under gravity.
Equipment: Computer with Data Studio software, Sonic motion sensor and basketball
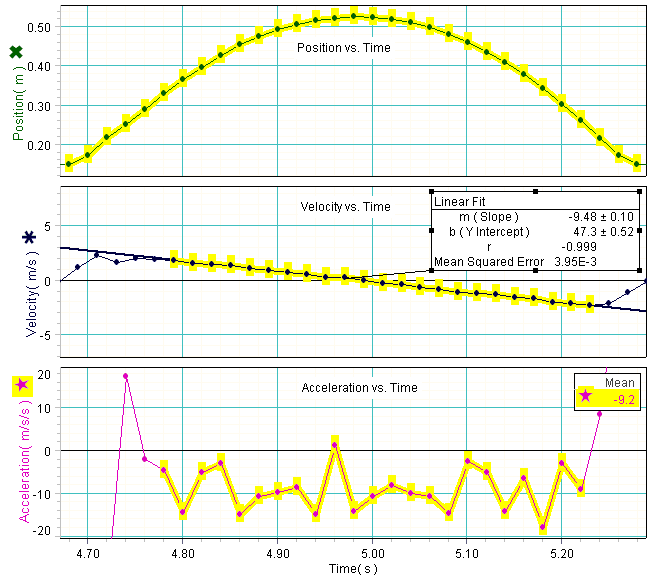
In this experiment the kinematics of a basketball under the influence of gravity is studied quantitatively. The ball is thrown upward above a motion sensor to plot its position, velocity and acceleration as a function of time. The graph below shows that the ball's vertical position changes quadratically as a function of time while its vertical velocity changes linearly. The tangential slope of the position curve is taken at each point to calculate the velocity vs. time plot. The ball's velocity is a maximum as the ball is first thrown upward, zero at the ball's maximum height, and negative its maximum value when the ball returns to its initial starting position. By using Data Studio's fitting algorithm, a fit to the velocity vs. time curve is found and the slope is calculated to be -9.48 m/s/s as shown.The acceleration graph is similarly computed by taking the tangential slope of the velocity vs. time curve at each point and plotted as a function of time. The mean of the acceleration vs. time curve is calculated by Data Studio to be -9.2 m/s/s. The numbers obtained by a linear fit to the velocity vs. time plot from above and the mean of the selected data points of the acceleration vs. time graph are in general agreement and close to the accepted value of gravity of 9.8 m/s/s.

All these concepts can be demonstrated quickly and efficiently during a classroom lecture.